

Your Front inbox is chock-full of customer data. With one inbox for email, social media, live chat, and SMS text conversations, plus access to data from your CRM or database, Front gives your team a holistic view of your customer communications.
But what if you’re using other tools to interact with your customers — such as a payment platform like Stripe or Square, or advertising networks like Google Ads or Facebook Ads?
By pulling all that data into a data warehouse, you can consolidate your customer information even further to gain a full picture of every customer’s interactions with your business.
To pull information into a data warehouse, you can use an Extract, Transform, Load (ETL) tool. In this post, we’ll walk through the process of connecting Front to a data warehouse with the Stitch ETL tool.
Three tiers of the data analytics architecture
Data sources like Front form a foundation for a data analytics stack that comprises three tiers: ETL software, data warehouse, and business intelligence (BI) software.
Stitch provides a simple, powerful ETL service for businesses of all sizes. Signup is simple — you can be moving data from one or more sources to a data warehouse in five minutes.
The last few years have seen the emergence of cloud-native data warehouses like Amazon Redshift, Google BigQuery, Snowflake, and Microsoft Azure SQL Data Warehouse. Because they run on cloud infrastructure that scales quickly and cost-effectively to meet performance demands, they can handle transformation using the same hardware on which the data warehouse runs.
Finally, to unlock the value of your data, you can connect a BI or data visualization tool to your data warehouse and create reports that analyze data from multiple sources, which you can share via browser-based dashboards.
1. Set up a data warehouse
Let’s set up a three-tiered data analytics stack, starting with the data warehouse. If your team generates business analytics reports, chances are you already have an account with one of these data warehouses. If you don’t, choose one that meets your needs. If you choose Redshift, BigQuery, Snowflake, or one of the other destinations Stitch supports, you can also follow the setup steps for your data warehouse in the Stitch documentation.
2. Set up Stitch for ETL
The next step is setting up an ETL pipeline to move data from Front and other data sources to the data warehouse. Stitch makes extracting data from a source and loading it into a data warehouse easy. To get started, visit Stitch’s signup page, enter your email address, then enter your name and a password.
3. Integrate Stitch with Front
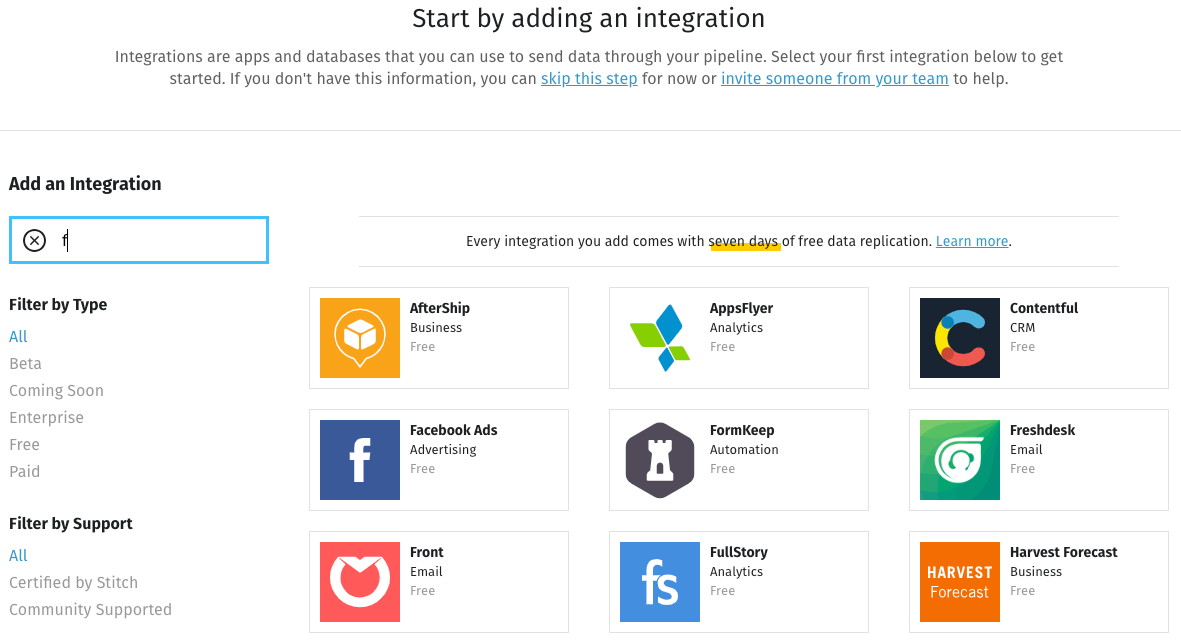
Next, add Front as an integration within Stitch. Click on the Front icon to get started:
The next screen prompts for several fields, starting with a name for the integration. This name will display on the Stitch Dashboard for the integration, and it’ll also be used to create the schema in your destination. Choose something descriptive but not too long.
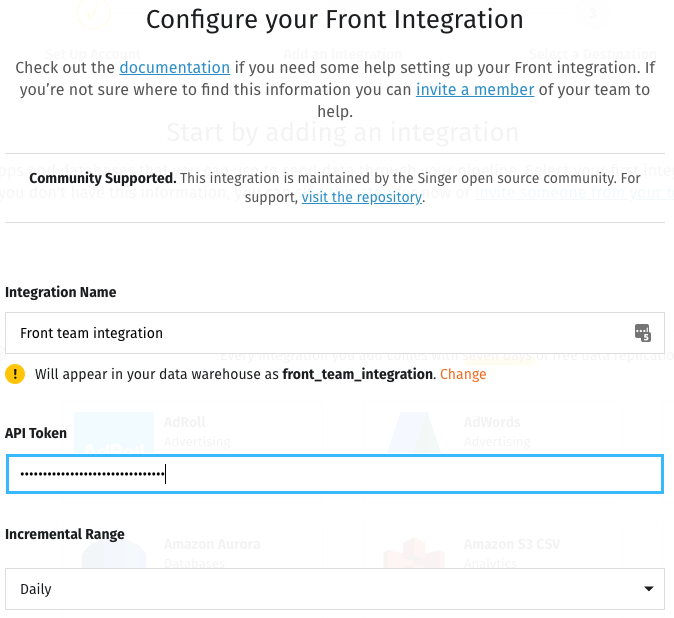
The next field is an API Token. You can generate it quickly from the Front application or web interface by following some simple steps, and move on to the next fields, but if you’re curious what an API token is, here’s the scoop. An API, or application program interface, is a way software developers make data available to other programs.
You don’t want your program to make your data available to just anybody, so an API token ensures that you have the necessary credentials. It ties your login information to the other program’s data access. Be sure to copy the data from the token and not the API Secret field.
Next, the Incremental Range field specifies how you want your Front data to be aggregated when it’s replicated to your data warehouse — hourly or daily.
Other settings on the screen let you specify how much historical data you want to copy to your data warehouse (the default is a year’s worth) and how frequently to move new data (the default is hourly). Click on Check and Save to continue.
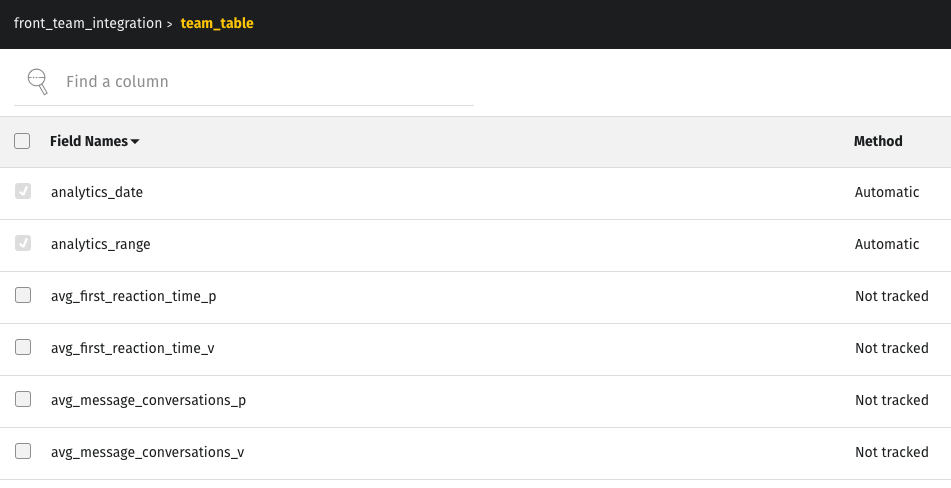
On the next screen you choose the data you want to replicate. When you click next to a table name, Stitch displays a list of columns in the table. Tick the field names you want to replicate. You can choose all the fields at once by ticking the box next to Field Names. Then click Finalize Selection.
Now you must tell Stitch where to put your data. Scroll up to the top of the screen and click on Destination.
4. Add a destination warehouse for your data
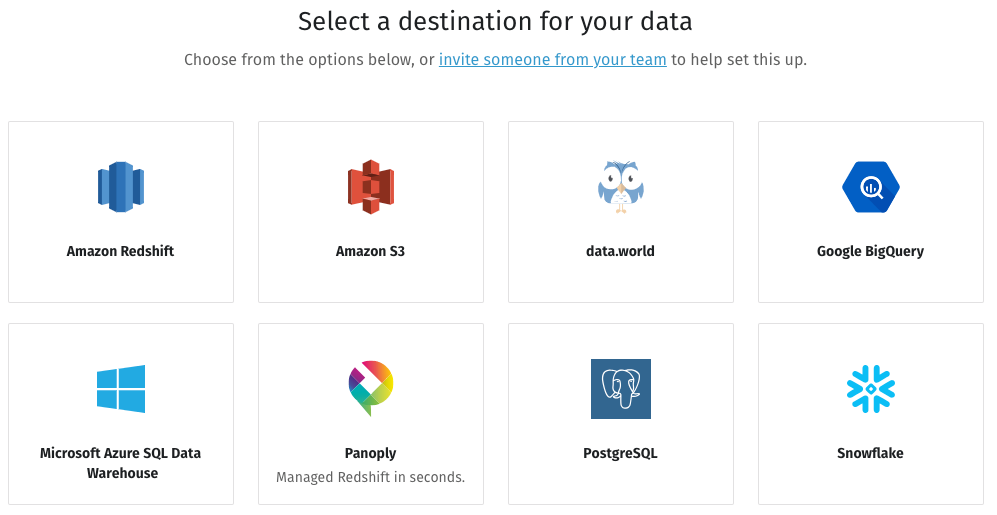
Suppose you’ve chosen an Amazon Redshift data warehouse. Click on the Redshift icon, enter your credentials, then click Check and Save.
Now all the pieces are in place, and your data is ready to flow.

When you visit your Stitch dashboard, you’ll see that your integration is marked Active. If you refresh the screen, you should eventually see a sync status of In Progress.
From the dashboard you can also add integrations from other data sources. The Stitch documentation walks through the process for each one.
5. Connect BI software to your data warehouse
The final stage of the process is connecting an analytics platform to your data warehouse. If you don’t already use BI software, you have dozens to choose from, including such popular options as Tableau, Microsoft Power BI, and Google Data Studio.
Now you have all the tools you need to see, for example, which customers need the most support or which are the most profitable, and you can tell whether you’ve been communicating with them at an optimal cadence or are targeting ads at the best cohort.
That’s all there is to it. Using an ETL tool like Stitch to move data from Front and other sources into a data warehouse lets you leverage the power of BI tools to correlate and report on your valuable data.
This story is a guest post by Lee Schlesinger, Content Marketing Manager at Stitch.
Written by Emily Hackeling
Originally Published: 17 April 2020